
From OTLP Logs to Healthcheck History in EdgeCDN-X
How healthcheck results travel from edge probes to the EdgeCDN-X UI.
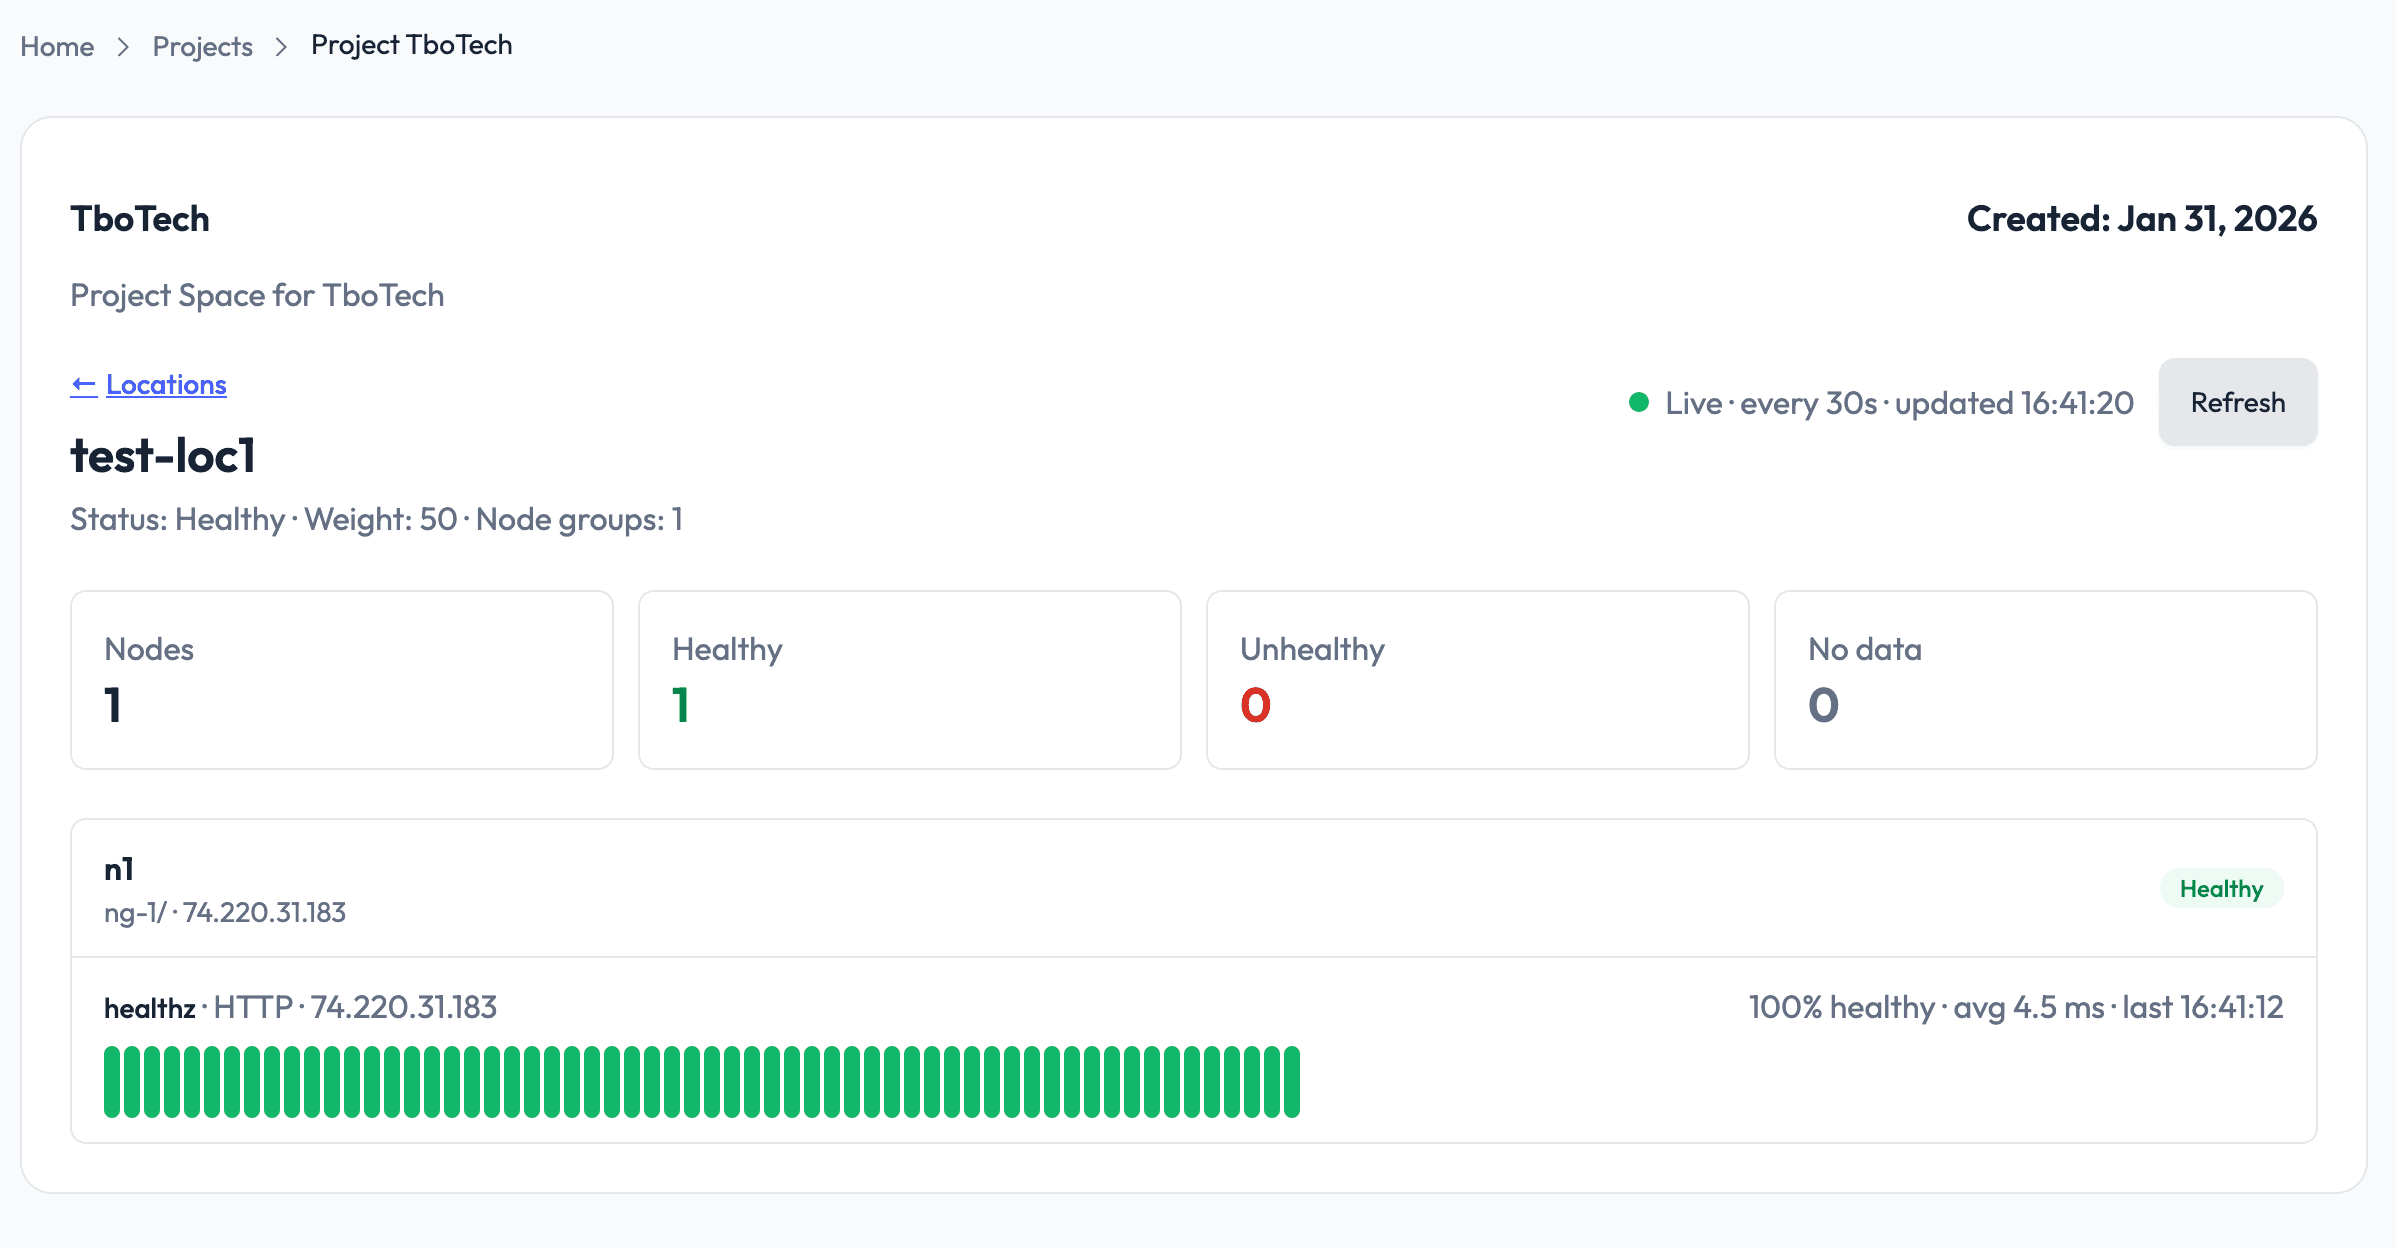
A node's current health status tells you whether it is available, but not what happened over the last few minutes. EdgeCDN-X brings recent probe results into the location view, helping operators see intermittent failures, inspect response messages, and compare probe durations without searching through raw logs.
The path connects OpenTelemetry Protocol (OTLP) logs, Fluent Bit, NATS, Benthos, and TimescaleDB. The application API turns the stored records into per-node healthcheck history for the user interface (UI).
From probes to structured events
With OTLP log export configured, the healthchecker emits a structured log for each probe execution, not just when health changes. Attributes include the node, location, check name and type, target, result code, message, alive flag, start time, and duration. A v attribute identifies the event format version, currently 1.
Fluent Bit on the routing cluster receives these logs through its OpenTelemetry input. A Lua filter copies OTLP attributes into the record, and a rewrite rule assigns a tag such as healthchecks.1.<cluster>. The agent forwards matching records to the central analytics endpoint over TLS, with certificate verification enabled.
Central Fluent Bit receives the forwarded records and publishes them to NATS. Versioned subjects let the downstream processor select the healthcheck format it understands:
Healthchecker -> OTLP logs -> Fluent Bit -> TLS forwarding
              -> Central Fluent Bit -> NATS -> Benthos -> TimescaleDB
              -> Application API -> Location health view
From NATS messages to time-series rows
The Benthos processing stage, deployed through the Redpanda Connect Helm chart, subscribes to healthchecks.1.> using a NATS queue group. It unpacks the JSON array emitted by Fluent Bit, extracts each record, and maps its fields into a PostgreSQL insert targeting the healthchecks table.
The processor converts the probe's start timestamp into a UTC timestamp and stores duration in nanoseconds. Separately, the database assigns the row's time using NOW(). This distinguishes when a probe started from when its result was inserted.
TimescaleDB stores these rows in a hypertable partitioned on time, with one-day chunks and a configured 30-day retention policy. NATS separates the collector's publishing path from the processor's database-writing path; the healthchecker itself does not need a database connection.
From stored results to the location view
The API queries recent records for the requested location, using a 15-minute window by default. It filters results against the location's active healthcheck profiles, groups them by node and check, and converts durations into milliseconds for display.
The UI loads immediately and polls every 30 seconds, requesting up to 60 results per check. Each series shows pass/fail history bars, the percentage of displayed results that were healthy, average duration, and the latest check time. A failed latest result also exposes its code and message.
app=# select time, code, location, node, target, alive from healthchecks limit 10;
             time              | code |     location     | node |    target     | alive
-------------------------------+------+------------------+------+---------------+-------
 2026-10-02 08:07:40.385163+00 |  200 | edgecdnx/fra1-c1 | n1   | 74.220.31.183 | t
 2026-10-02 08:07:51.78018+00  |  200 | edgecdnx/nyc1-c1 | n1   | 74.220.24.46  | t
 2026-10-02 08:07:55.383383+00 |  200 | edgecdnx/fra1-c1 | n1   | 74.220.31.183 | t
 2026-10-02 08:08:06.77959+00  |  200 | edgecdnx/nyc1-c1 | n1   | 74.220.24.46  | t
 2026-10-02 08:08:10.384444+00 |  200 | edgecdnx/fra1-c1 | n1   | 74.220.31.183 | t
 2026-10-02 08:08:21.779253+00 |  200 | edgecdnx/nyc1-c1 | n1   | 74.220.24.46  | t
 2026-10-02 08:08:25.383854+00 |  200 | edgecdnx/fra1-c1 | n1   | 74.220.31.183 | t
 2026-10-02 08:08:36.781298+00 |  200 | edgecdnx/nyc1-c1 | n1   | 74.220.24.46  | t
 2026-10-02 08:08:40.38498+00  |  200 | edgecdnx/fra1-c1 | n1   | 74.220.31.183 | t
 2026-10-02 08:08:51.779501+00 |  200 | edgecdnx/nyc1-c1 | n1   | 74.220.24.46  | t
(10 rows)
Nodes without results appear as "No data." If a refresh fails, the UI retains the previous results and displays an error, rather than replacing the history with an empty view.